
Win rate is down. Sales says "competitive pressure" but can't quantify it. You're making investment decisions on a number nobody can decompose. RAINCLOUD turns competitive losses into a line item you can measure, attribute, and fix.
See Where Your Pipeline Is Leaking →Sales reports "competitive loss" in the CRM, but that's where the data ends. You don't know if you lost on price, product, or execution. You don't know which competitor is taking the most pipeline. You can't tell the board whether this is a $500K problem or a $5M problem — because nobody has ever done the math.
You added 8 AEs this year. Pipeline is up, but revenue isn't tracking proportionally. The cost per competitive win has climbed and nobody can tell you if it's because the reps are undertrained, the market shifted, or the product fell behind. You're running a multi-million dollar sales organization and the unit economics are a black box.
Not every lost deal was saveable. Some were bad fits, some were unwinnable on price, some were political. But right now you have no mechanism to distinguish between a $180K deal lost because a rep didn't know the competitor's pricing changed, and a $180K deal lost because the prospect was the competitor's cousin. One is fixable. One isn't. The difference is millions in recoverable pipeline.
Gong, Clari, Outreach, Salesforce, the conversation intelligence platform, the forecasting tool, the enablement platform. The tech stack costs seven figures annually and you have no competitive attribution data to determine which tools are actually moving win rates. You're renewing contracts on faith.
RAINCLOUD quantifies what competitive losses actually cost you — by competitor, by root cause, by fixability. For the first time, you can make investment decisions about competitive readiness the same way you make every other capital allocation decision: with data.
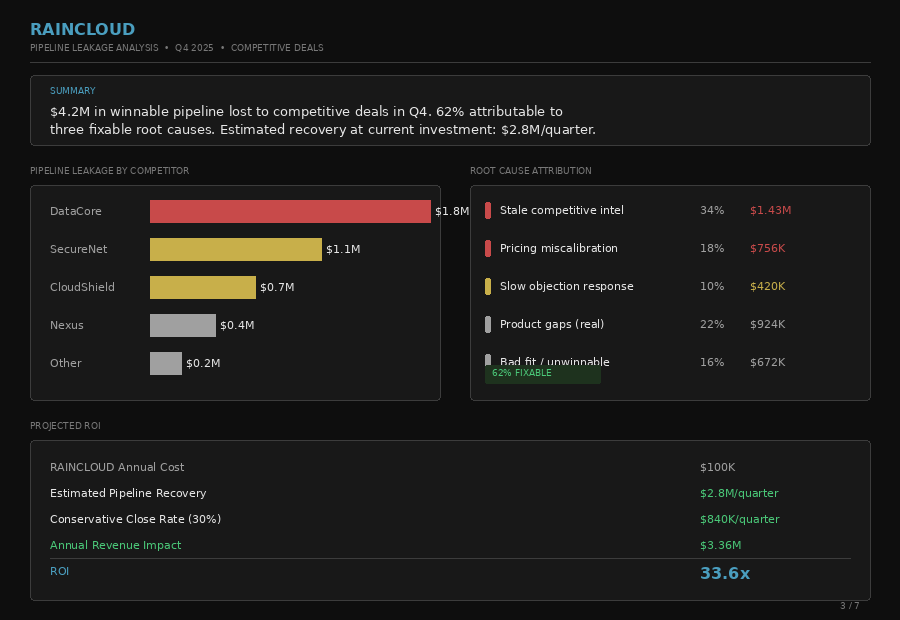
This is the report your sales team has never been able to produce. We analyze your competitive losses, quantify them by dollar amount, attribute root causes, and classify what's fixable vs. structural. You'll see how much pipeline is leaking, to whom, and what it would take to recover it.
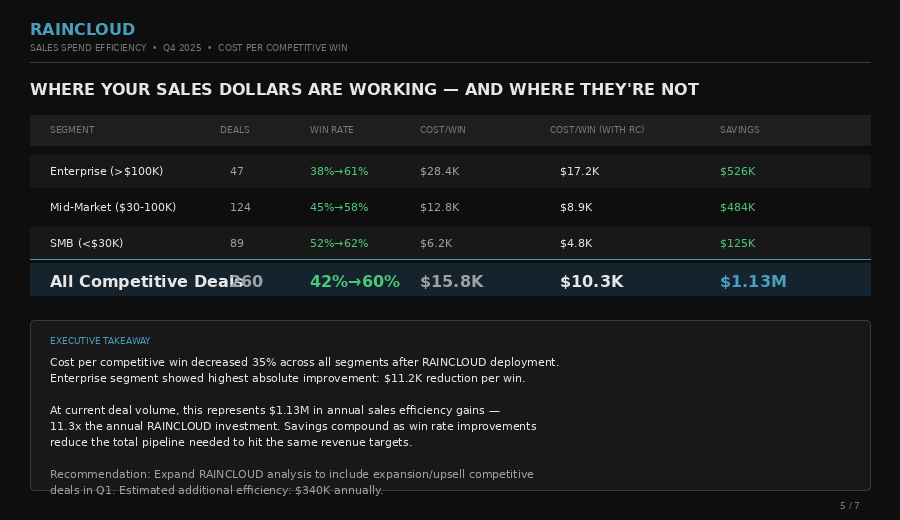
We help you see cost-per-competitive-win by segment, with before and after benchmarks as intelligence takes hold. This ties competitive intelligence directly to your unit economics in a way that's never been possible before.
"For the first time, I can tell the board exactly where our competitive pipeline is leaking and exactly what we're doing about it. That's not a sales tool — that's a governance capability."
RAINCLOUD doesn't ask you to believe in competitive intelligence as a concept. It asks you to look at the numbers. Here's what we typically see across our client base.
Not product gaps. Not pricing. Deals lost because a rep didn't know the competitor changed their pricing, because a battlecard was 8 months stale, or because an objection surfaced that the team had already learned to handle — but the knowledge never made it back to the field.
Based on a mid-market SaaS company with 250+ competitive deals per quarter. Your number will depend on deal volume and average deal size, but the pattern is consistent: this is pipeline that was already being worked. The deals existed. The reps were in them. They just didn't have the intelligence to win them.
At $100K annually, RAINCLOUD costs less than one junior hire. It analyzes more data than a team of five. And unlike headcount, the output improves every quarter as the pattern library compounds. The exact multiple depends on your deal volume and competitive intensity.
When reps know what they're walking into, they close faster, discount less, and lose fewer winnable deals. The same pipeline produces more revenue at lower cost. That's not a sales improvement — that's an operating leverage improvement the board will notice.
For the first time, a dollar figure attached to every competitive loss — decomposed by competitor, by root cause, by fixability.
Not every loss is preventable. But when you can separate the fixable from the structural, you know exactly where to invest.
Costs less than one junior hire. Analyzes more data than a team of five. Output improves every quarter. Exact multiple varies by deal volume.
Same pipeline, more revenue, lower CAC. The efficiency gain compounds as intelligence improves.
Reps stop giving away margin when they know what competitors actually charge. Discounting drops because confidence rises.
A document you and the CRO can present together. Data-backed. Attribution-clear. No more anecdotes disguised as strategy.

The Intelligence Audit quantifies your competitive pipeline leakage in two weeks. You'll have a dollar figure, a root cause breakdown, and a clear ROI case — before you commit to anything ongoing. $7,500, credited against any retainer.
Book Your Intelligence Audit →